.svg)

Well, not all by myself.
What BI publishers forget to tell you about dashboards.
You may have already heard of Power BI. Microsoft markets it as the miracle tool for "turning your data into insights." 350,000 companies use it. Consultants give impressive demonstrations with graphics that move in all directions.
And yet, most BI projects fail or disappoint.
Not because the tool is bad. Because we're approaching the problem from the wrong angle.
The real problem is not the tool
Gartner estimates that 60 to 70% of the time spent on a BI project is devoted to data preparation. Not to creating attractive graphics. To cleaning, structuring, and reconciling data that comes from all over the place.
Your data is probably in this state:
• The sales rep who has his own Excel file with "his" version of the turnover
• Accounting figures that differ from those in the ERP system
• Customer codes that do not match between CRM and billing
• The file "FINAL_v3_corrected_DEF.xlsx," which must not be touched under any circumstances.
Power BI won't fix that. If you plug a visualization tool into inconsistent data, you'll get inconsistent charts. prettier, but still wrong.
What Power BI does really well
Once we understand that, let's talk about what the tool actually does.
Power BI is a data visualization and sharing tool. It excels in three areas:
1. Connect heterogeneous sources
Over 100 native connectors: SQL Server, Oracle, Salesforce, SAP, Excel files, REST API, SharePoint, Google Analytics... You can cross-reference data that has never been reconciled before.
2. Create interactive dashboards
Visuals that respond to clicks, dynamic filters, drill-down. A manager can view overall sales and then click to drill down by region, sales representative, or product. Without asking someone to redo an export.
3. Share and collaborate
Cloud publishing, mobile access, Teams integration. The same report viewed by 50 people, each with their own access rights. No more emails with Excel files "for your information."
How much does it really cost?
Microsoft charges $14/user/month for Power BI Pro (a 40% increase in April 2025, which went relatively unnoticed). That seems reasonable.
What they don't tell you:
• Everyone must have a license. The person who creates the report AND those who view it. A team of 30 people = 30 licenses = $420/month = $5,000/year.
• The limit of 1 GB per dataset. Beyond that , you must upgrade to Premium Per User ($24/month) or Premium Capacity (starting at $4,995/month).
• The hidden cost of preparation. The time spent cleaning your data, building the model, training users. This is where the budget skyrockets.
That said, Power BI remains the least expensive BI tool on the market with comparable features. Tableau starts at $115/user/month. Qlik starts at $825/month for a team.
The limits you need to know
DAX is complex. The Power BI formula language allows for powerful calculations, but the learning curve is steep. For simple needs, no problem. For sophisticated business calculations, expertise is required.
Microsoft integration is a double-edged sword. If you're on Microsoft 365 and Azure, it's seamless. If you're on Google Workspace or AWS, it's less natural.
Power BI does not structure your data. It displays it. If your source is poorly organized, the report will be too.
And what about Fabric in all this?
Microsoft is now promoting Fabric, a platform that includes Power BI. Forrester ranked it as a Leader in Data Fabric Platforms in Q4 2025. 28,000 organizations use it.
In short: Fabric is what Power BI was missing. A single location (OneLake) to store, transform, and govern your data BEFORE visualizing it.
Fabric includes data ingestion, data warehousing, real-time processing, data science, and Power BI for visualization. Everything integrated, everything connected.
Who is it for? Mid-sized companies and large SMEs with distributed data and governance challenges. For an SME with 30 employees and simple needs, Power BI alone may suffice.
Alternatives exist
Power BI isn't the only option. Here's how the others stack up:
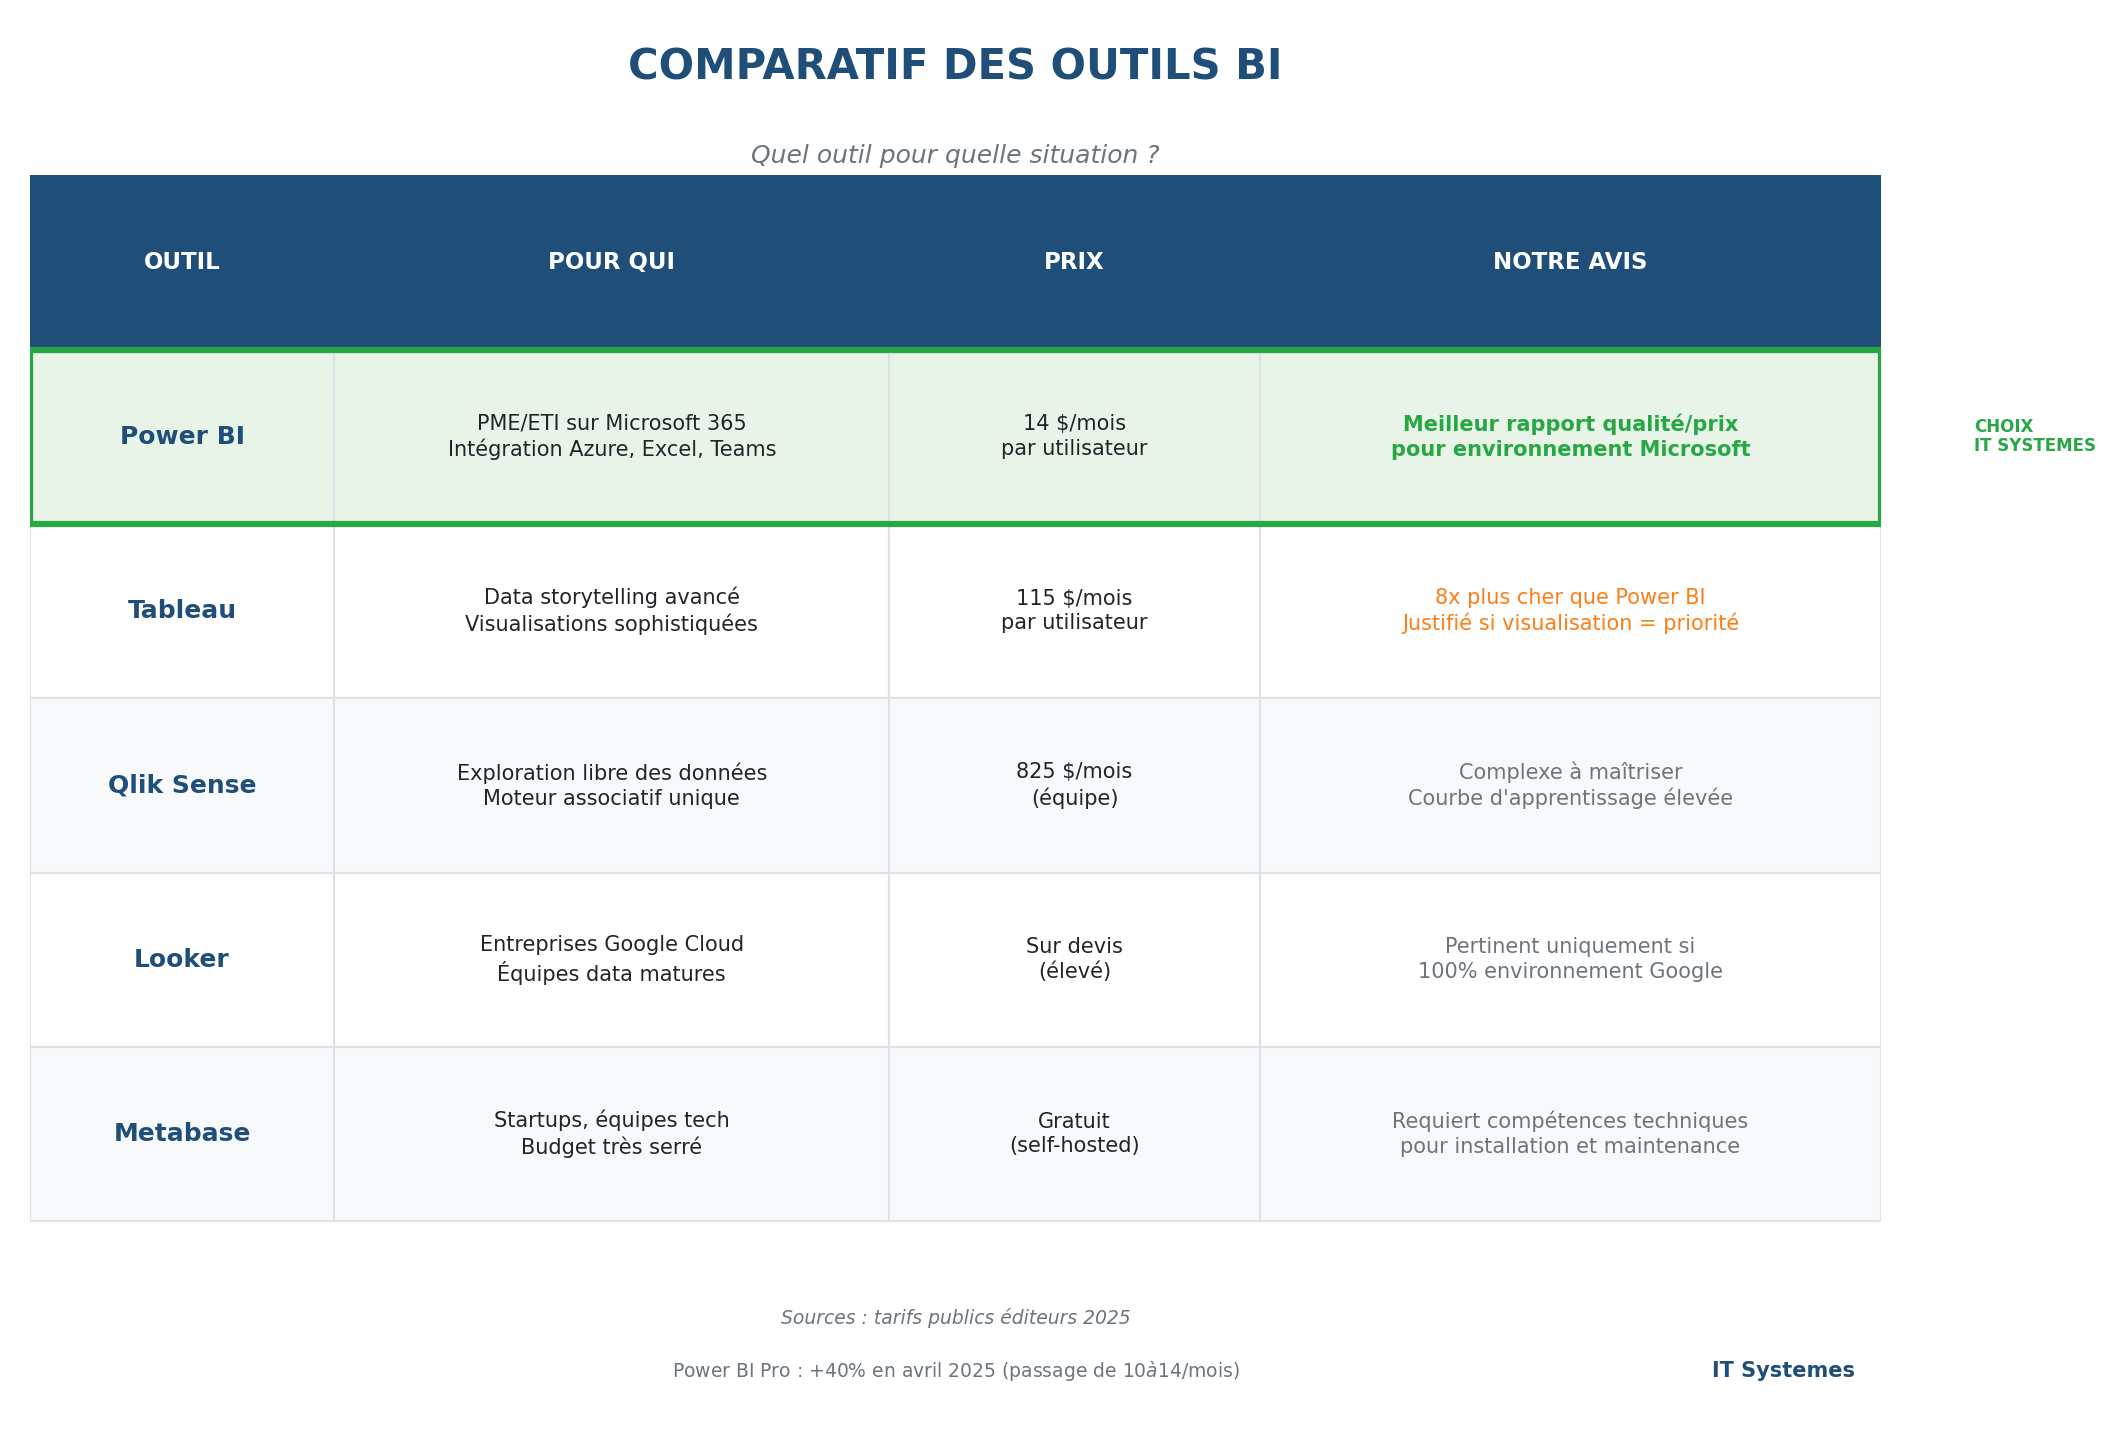
Our opinion: if you are on Microsoft, Power BI is the logical choice. The feature/price ratio is unbeatable. The others are relevant in specific contexts (Google Cloud, very advanced visualization needs, zero budget with technical skills).
Three situations that we often encounter
"We spend three days a month on reporting."
Industrial SME, 50 employees. The management controller manually compiles data from the ERP, production, and HR systems. Three days of work each month. Risk of error. Figures become obsolete as soon as they are published.
After Power BI: direct connection to sources, automatic daily refresh, dashboards accessible in real time. The management controller spends three days analyzing instead of compiling.
"Every salesperson has their own figures."
Service company, 100 employees. No consolidated view of sales. Each sales representative tracks their own activity independently. Sales meetings turn into debates about who has the best figures.
After Power BI: a single source connected to CRM. Each sales representative sees their filtered figures. The sales director has the overall view. No more fruitless discussions, just strategic discussions.
"The CEO wants to see everything at a glance."
Retail group, 200 employees, 15 points of sale. The CEO receives emails from each store with Excel files. Impossible to compare, impossible to react quickly.
After Power BI: a dashboard on a tablet showing consolidated sales, average basket size, and differences vs. N-1. Click on a store to see the details. The CEO checks his indicators at breakfast.
So, what do we do?
Power BI is a good tool. But it's a visualization tool, not a miracle solution.
Before discussing dashboards, we need to talk about data:
1. What are your sources? Are they reliable?
2. Who is responsible for which data?
3. How is the data updated?
4. What is the target model? (and no, "everything in Excel" is not a model)
That's what we do at ITSystemes we start by analyzing your data before talking about dashboards. Because a beautiful graph based on false data is still false data.


.svg)